

Inspect waveforms with an oscilloscope
2.6.4
Author: VCV
License: GPL-3.0-or-later
Last updated:
Created:
Plugin: VCV Free
An oscilloscope visualizes voltage signals over time. The design and functionality of VCV Scope is based on vintage analog oscilloscopes, which are popular tools among Eurorack synthesizer users for understanding CV and audio signals.
Patch any cable into IN 1 or IN 2 to see its voltage over time. Outputs OUT 1 and OUT 2 are provided for convenience to pass the signal through to other modules if needed.
The TIME knob zooms the screen horizontally, displaying a duration as short as 5 milliseconds to as long as 50 seconds.
The GAIN 1 & 2 knobs zoom the screen vertically, displaying a voltage range as much as 20 V peak-to-peak (pp) to as little as 0.078 V. The OFST 1 & 2 knobs pan the screen vertically, effectively applying a voltage offset to the signal before zooming.
Directly above and below the scope display are the the minimum, maximum, and peak-to-peak voltage (pp, equal to max - min) of both signals in the viewport.
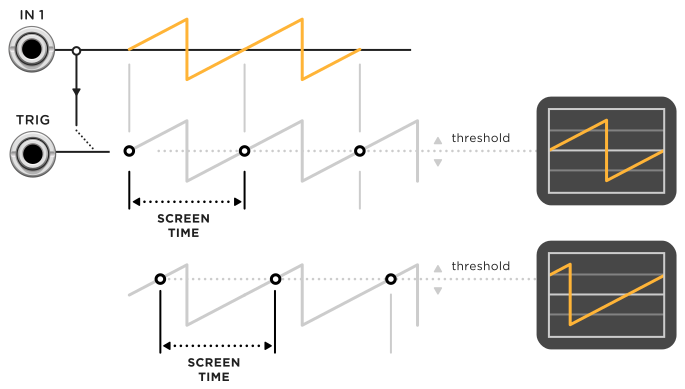
Click the TRIG button to enable trigger mode, which is useful for synchronizing the display to the beginning of periodic audio-rate signals. In this mode, the scope does not start measuring either signal until the IN 1 voltage passes upward through the threshold voltage. This threshold is set from the THRES knob and shown on the display with a T symbol. Alternatively, an external trigger in the TRIG input can be used instead of IN 1 to start measuring.
2D mode
Click the 1x2 button to switch from 1&2 (dual) mode to 1x2 (2D) mode. In this mode, the IN 1 signal controls the horizontal (X) position of the scope, while IN 2 controls the vertical (Y) position.
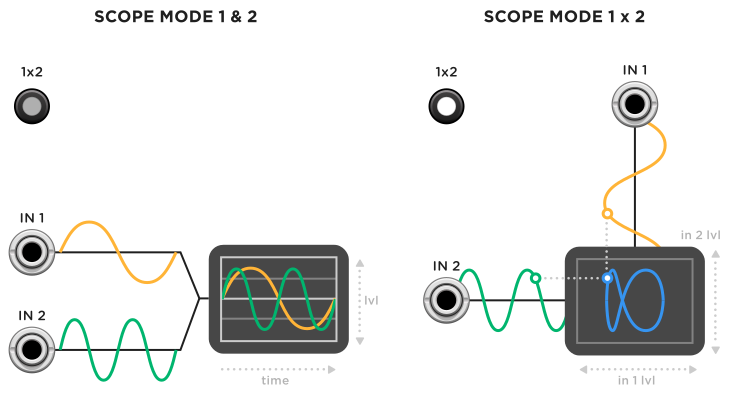
The TIME knob controls the rate of sampling. If monitoring two audio-rate signals, set TIME to a fast sampling rate to display smooth, accurate curves. For slower CV-rate signals, adjust TIME to control the length (memory) of the scope path.
If two sine waves of different frequencies are monitored in this mode, a Lissajous curve appears. Experiment with different waveforms and frequencies to draw interesting shapes in 2D mode!